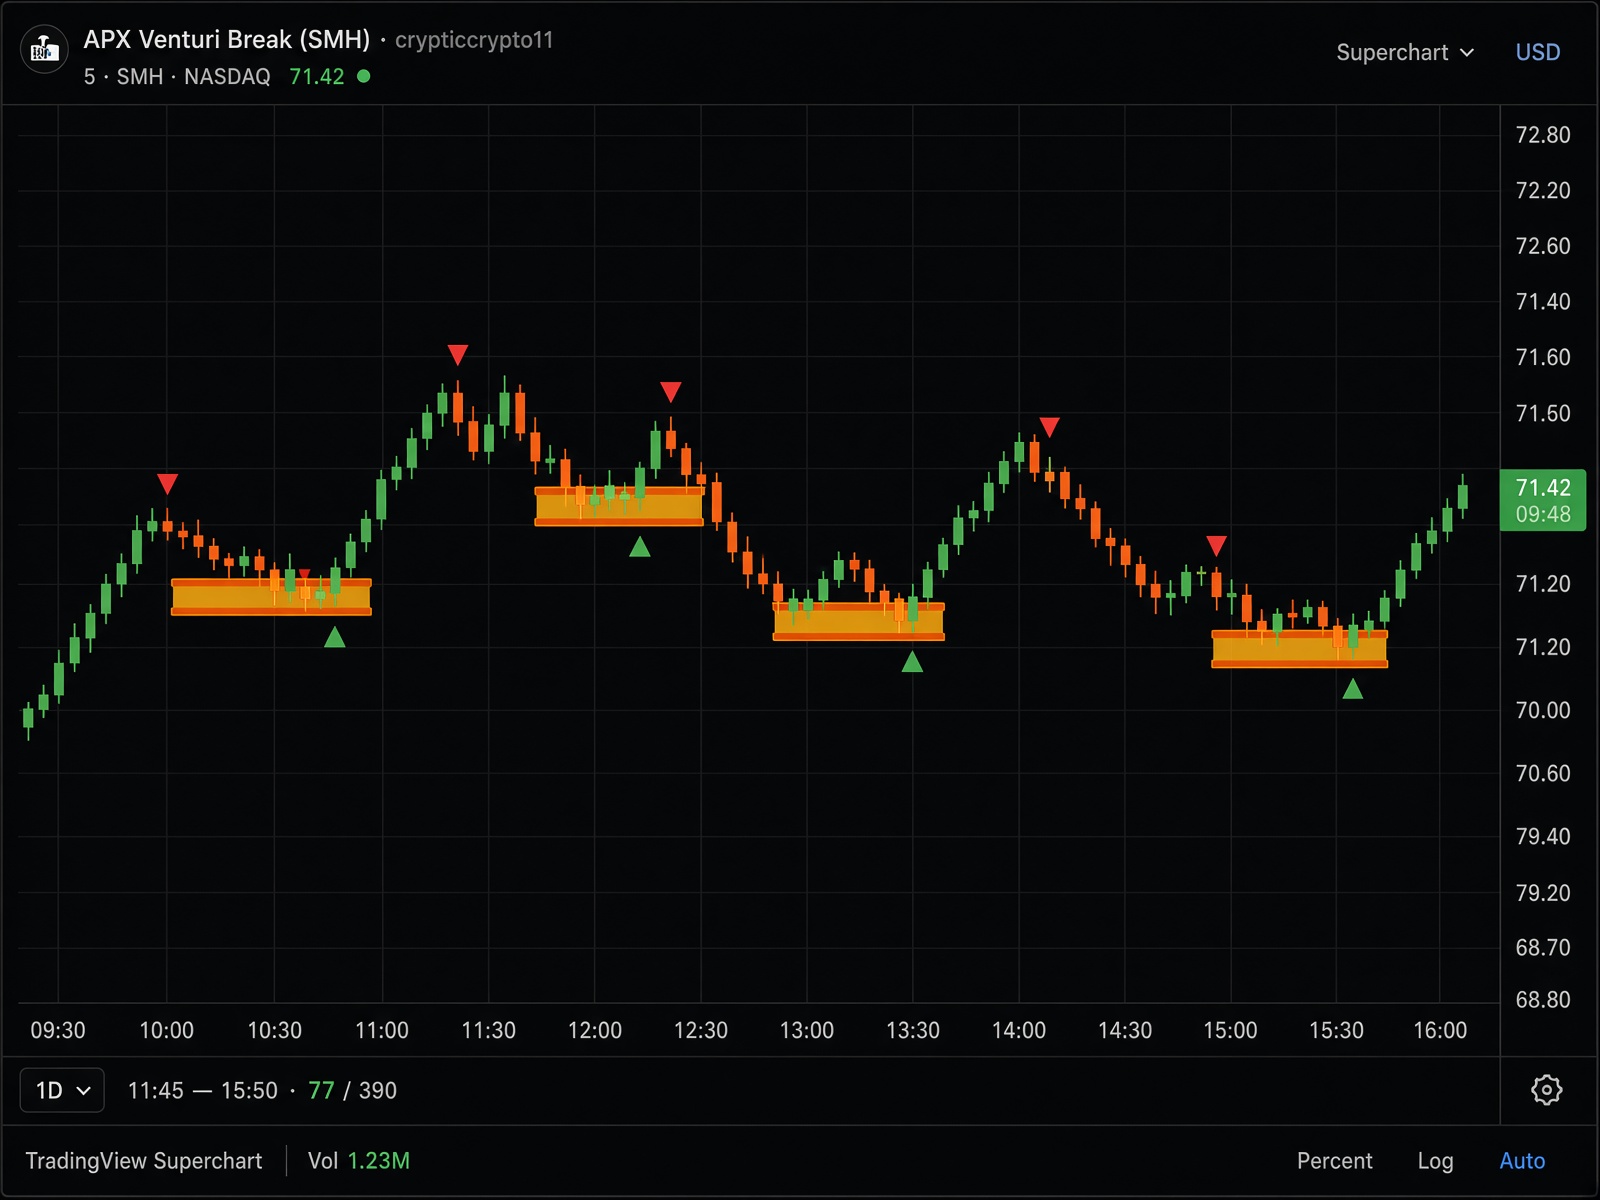
01Orange squeeze bands, yellow fill on compression
02Green / red break triangles for the session
03Dynamic parameters for minute timeframes (SMH)
04Alerts on the first bar out of the squeeze
FAQ
What is APX Trading?
Five free public TradingView scripts. Discord, education, and the Screener are paid. Starter $59.99/mo. Pro $599.99/yr adds Elite Discord. No trial.
Starter or Pro — what’s the difference?
Scripts are free on both. The paid desk is Discord, education, and the Screener. Starter is $59.99/mo. Pro is $599.99/yr and adds Elite Discord only. No free trial.
How do I install APX on TradingView?
Open TradingView. Go to Indicators, then search crypticcrypto11 or the script name, or open https://www.tradingview.com/u/crypticcrypto11/. Add the scripts you want. They are free and public. The paid desk is Discord, education, and the Screener. Full steps: https://apxtrading.io/install
Is APX a signal service?
No. Scripts are tools, not signals. Charting toolkit only. Not financial advice.
Does APX work on free TradingView?
Yes. A free TradingView account can add the public scripts. The Screener seat is separate and paid.