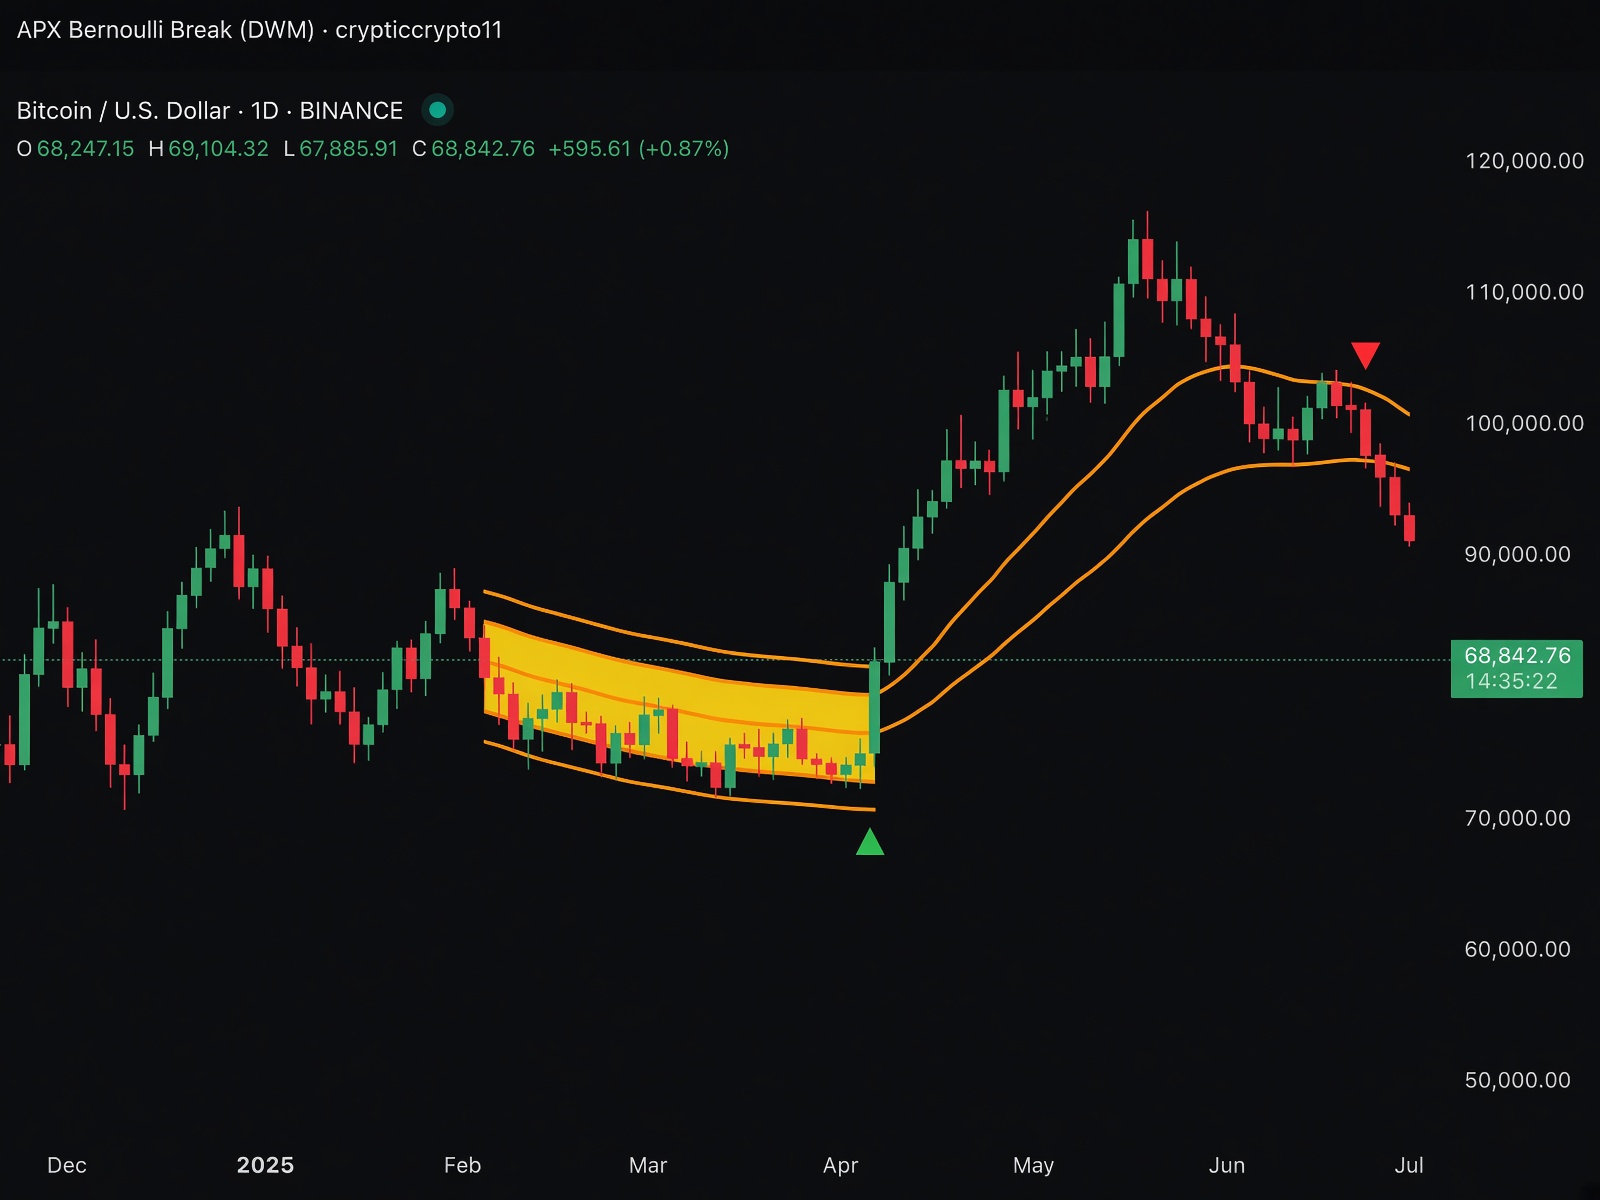
01Orange squeeze bands with yellow fill while compressed
02Green up-triangles on bullish breaks
03Red down-triangles on bearish breaks
04Adaptive thresholds on daily, weekly, and monthly
FAQ
What is APX Trading?
Five free public TradingView scripts. Discord, education, and the Screener are paid. Starter $59.99/mo. Pro $599.99/yr adds Elite Discord. No trial.
Starter or Pro — what’s the difference?
Scripts are free on both. The paid desk is Discord, education, and the Screener. Starter is $59.99/mo. Pro is $599.99/yr and adds Elite Discord only. No free trial.
How do I install APX on TradingView?
Open TradingView. Go to Indicators, then search crypticcrypto11 or the script name, or open https://www.tradingview.com/u/crypticcrypto11/. Add the scripts you want. They are free and public. The paid desk is Discord, education, and the Screener. Full steps: https://apxtrading.io/install
Is APX a signal service?
No. Scripts are tools, not signals. Charting toolkit only. Not financial advice.
Does APX work on free TradingView?
Yes. A free TradingView account can add the public scripts. The Screener seat is separate and paid.